We hear you.
Sometimes you're replaying session recordings in FullStory and feel too close to the action. You wish you could step back to see the big picture—and see it quickly:
How are all of my users, and not just the one, engaging with this page on my site?
You want a fast way to visualize aggregate user interactions. A map to show you the “lay of the land”—and one you can grok at a glance.
Say, wouldn’t it be great if FullStory had heatmaps?
We think it would. And we just launched Engagement Heatmaps on FullStory.
Press pause. Engage heatmaps!
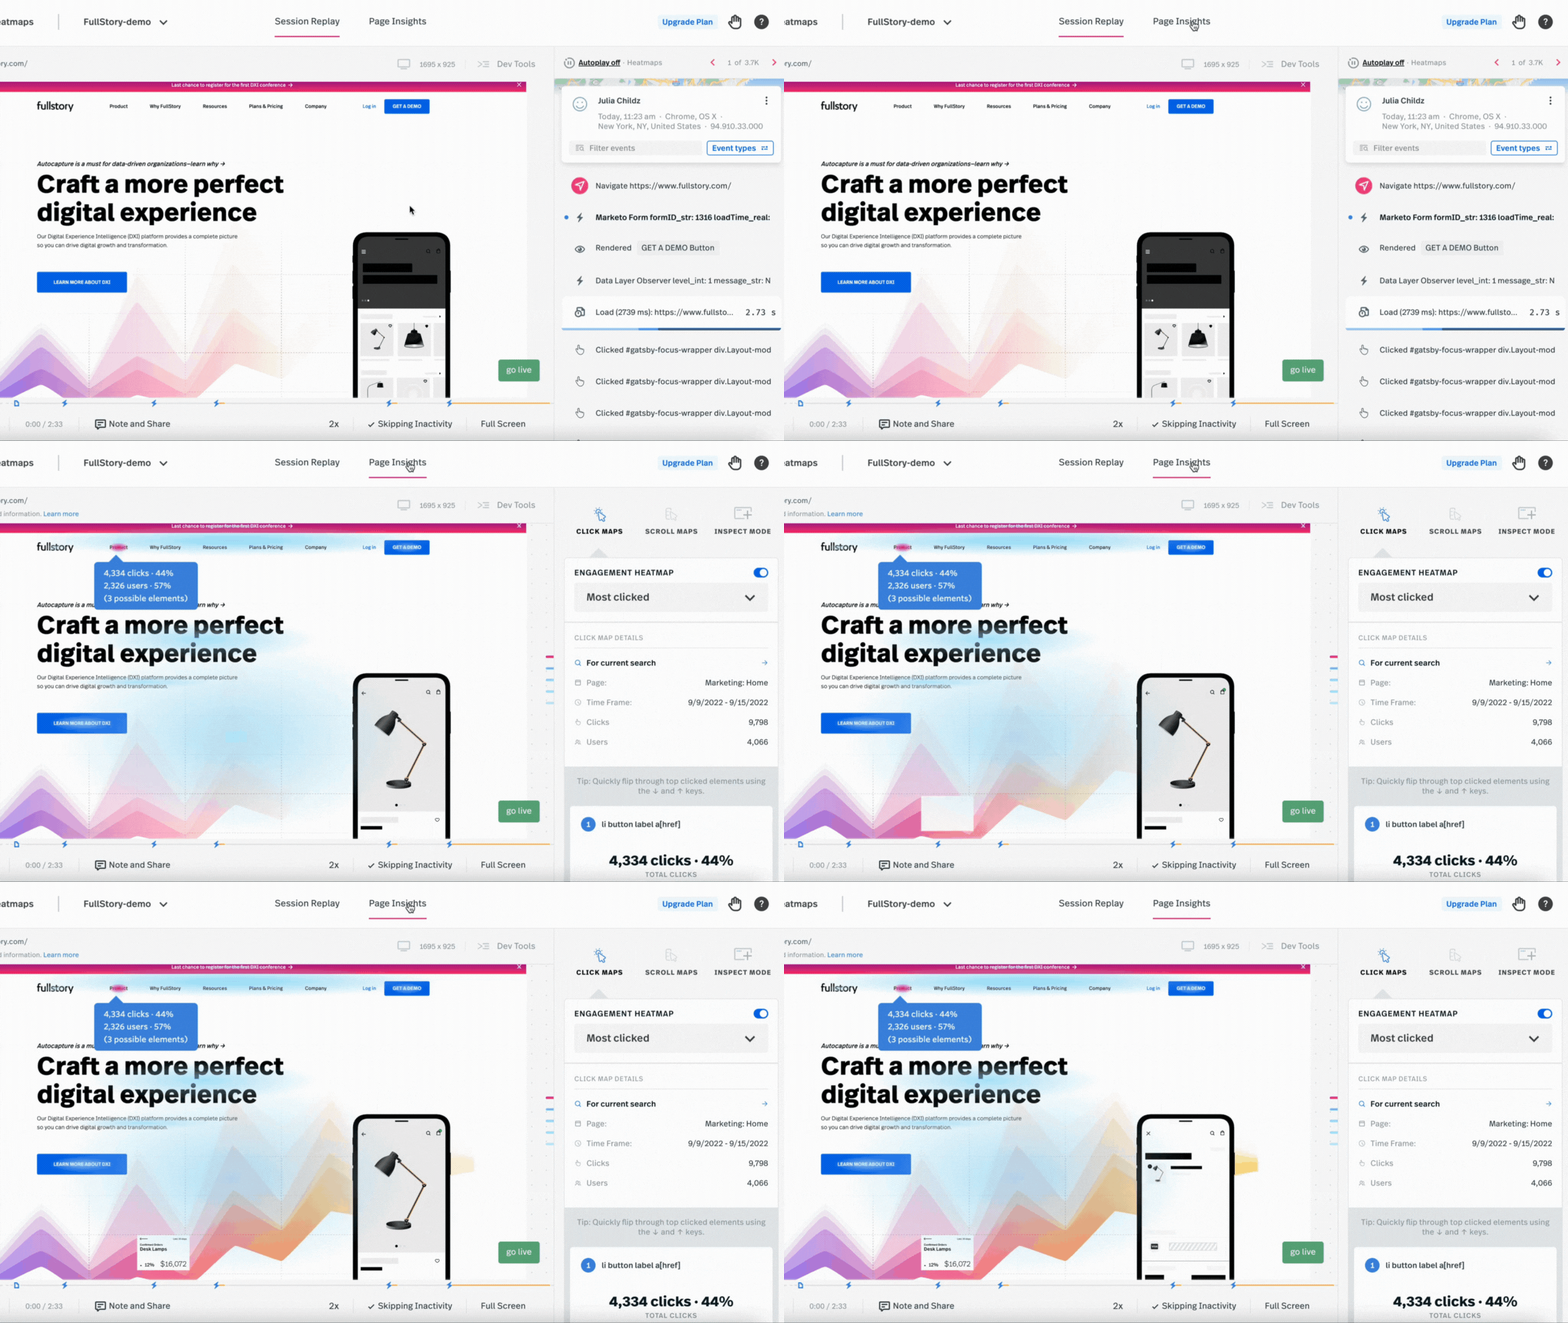
Next time you play back a session recording in FullStory, mouse up and click Page Insights to get an Engagement Heatmap.
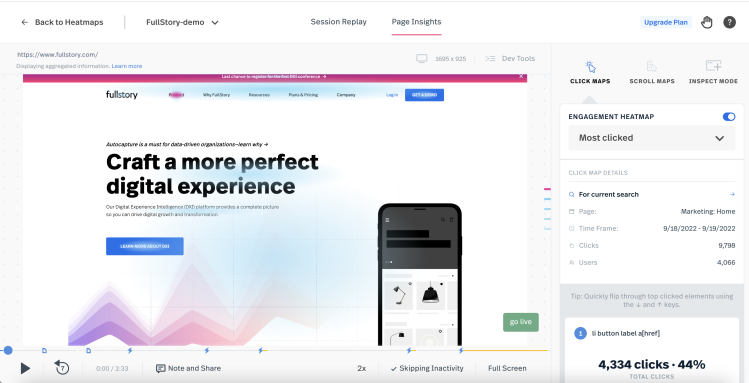
The result is an instantly generated colorful visualization of aggregated click data for all users in the current search or segment in FullStory. You get a snapshot of how your segmented users are clicking, grokked at a glance by using color to focus your attention.

Engagement Heatmaps provide context, a high-level perspective for any page or page-state. What's more, our heatmaps are generated based on any set of users you want, ready for you whenever you like and accessible directly from session replay.
Simply pause a session replay for Page Insights with Engagement Heatmaps in FullStory.
A complement to Click Maps
If you’re a long-time FullStory user, you might recall we launched Click Maps awhile ago.
As we saw it then and still maintain today, Click Maps are a powerful way to sidestep some of the major problems with traditional heatmaps. That is, problems like approximating [X, Y] positions, accounting for dynamic app states and page overlays, configuration, and the pesky challenge of “splotch” mapping. We covered these 4 major problems of heatmaps before.
Despite these challenges, heatmaps have a major advantage over Click Maps: heatmaps are a much faster way to contextualize aggregate user trends for a given page. They give you a useful impression. You can see what clicks—quick.
And what heatmapping tools may lack when it comes to precision, they make up for in time to insight.
Engagement Heatmaps speed up "time to insight"
Wait. What’s time to insight?
At FullStory we’ve spent a lot of time thinking about analytics and insights. In particular, we think about the relationship between data relevance and time—something we call “time to insight.”
Time to insight is how long it takes to go from “Ah, hmm … 🤔” to “Aha! 😍” And at FullStory, it's a useful frame for assessing the value of a given feature.
A fast time to insight can make all the difference when it comes to taking decisive action quickly. How often do you receive incredible new knowledge when it’s no longer relevant? When it comes to insights about your tens of thousands or even millions of users, timing is everything.
Engagement Heatmaps speed your time to insight. They make it fast and easy to shift from the ground-level perspective of a single user's interactions on a page to high-level insight about how lots of users engage with that same page. From the micro to the macro fast.
Finally, our Engagement Heatmaps can also show you engagement by our popular frustration signals. You can go from your top-level Engagement Heatmap to one based on Rage Clicks, Dead Clicks, or Error Clicks. (Learn more about Engagement Heatmaps and Page Insights generally, here.)
Turn up the heat with FullStory Engagement Heatmaps
And that’s it. We heard you wanted heatmaps, and while we took a small detour on the way to offering them, Engagement Heatmaps are now a part of FullStory.
To access your colorful new heatmaps—or our classic Click Maps—click into Page Insights from within any session replay in FullStory. The replay will pause so you can get a high-level view of how your entire segment is engaging with the screen in question. You can also create a heatmap directly from the Heatmaps library section in the FullStory left menu. From there, simply search for a specific URL or a page that's defined in FullStory to see how users are interacting with elements on that page.
Use FullStory’s heatmaps on your homepage, your products page, your purchase form, or your new feature UI. Once you break a sweat with our heatmaps, let us know what you think!


